resources & media
Fuel Mix
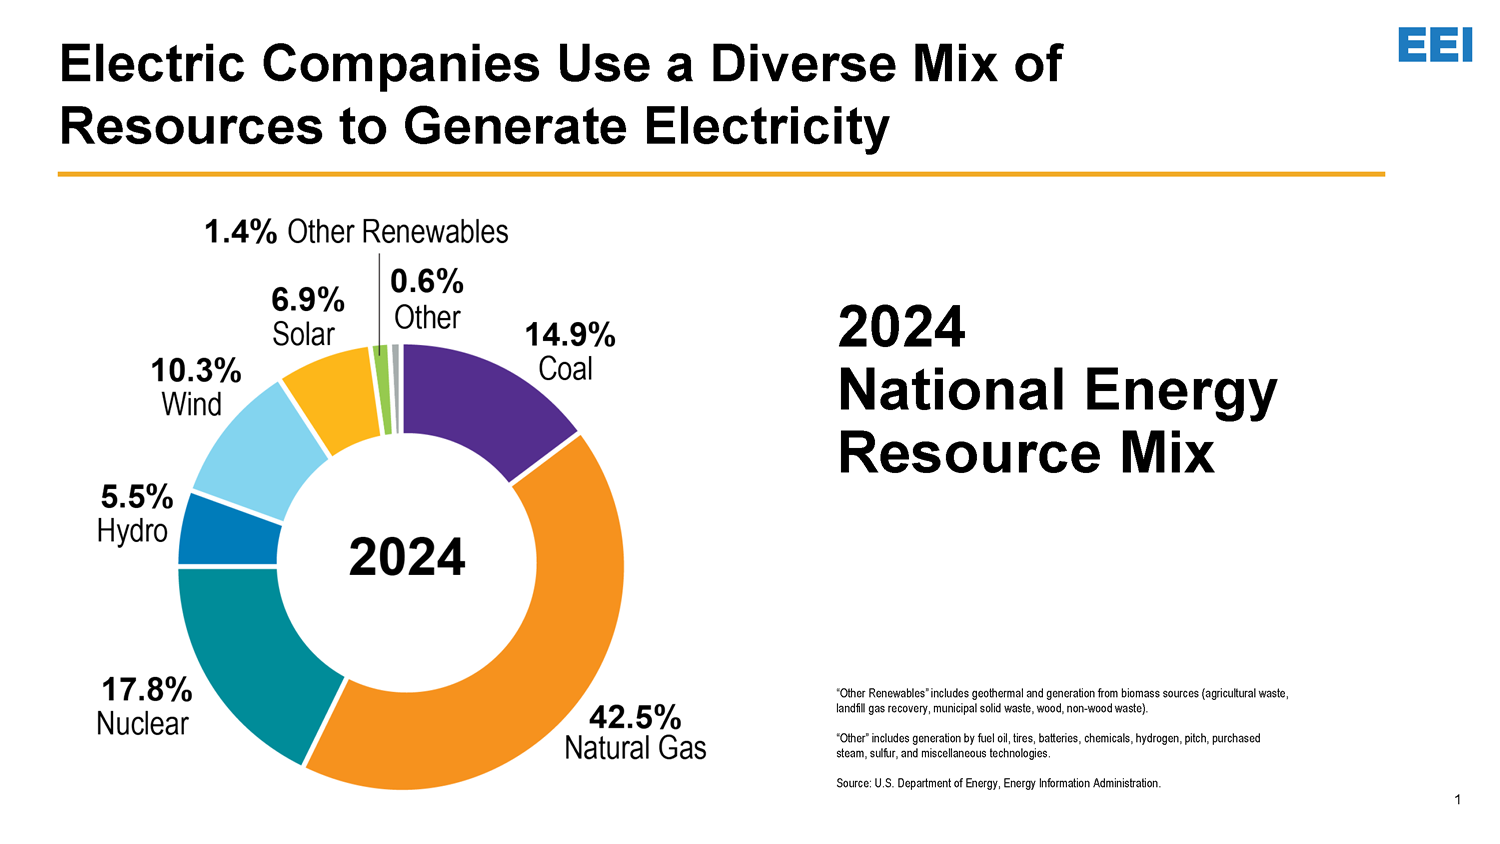
2024 National Energy Resource Mix
- Coal provided 14.9 percent of our nation's electricity.
- Natural gas supplied 42.5 percent.
- Nuclear energy produced 17.8 percent.
- Wind provided 10.3 percent.
- Hydropower provided 5.5 percent of the supply.
- Solar provided 6.9 percent.
- Other renewable resources, such as biomass and geothermal provided 1.4 percent.
- Other fuel sources, including fuel oil, provided 0.6 percent of the generation mix.
The Mix of Resources Used to Generate Electricity Has Changed Dramatically
Electric Companies Use a Diverse Mix Of Resources to Generate Electricity
Emission Reductions
- As of year-end 2024, the electric power sector’s carbon emissions were nearly 41 percent below 2005 levels. In addition, emissions from the electric power sector are no longer the leading source of the nation’s CO2 and have been lower than the emissions from the transportation sector since 2016.
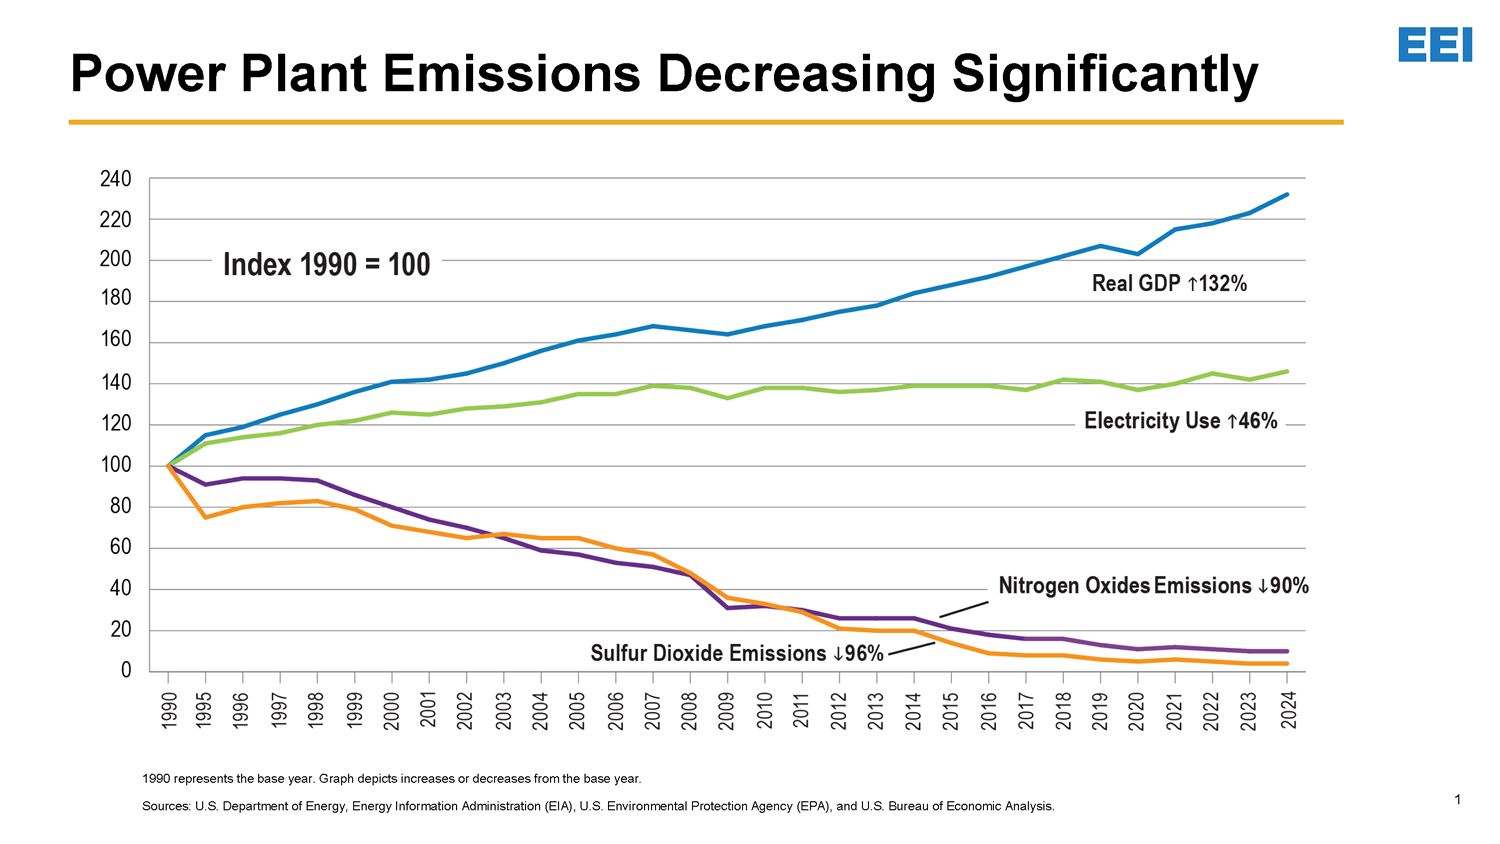
- Since 1990, the industry has cut sulfur dioxide (SO2) emissions by 96 percent and nitrogen oxides (NOx) emissions by 90 percent.
- As a result of the Mercury and Air Toxics Standards and other Clean Air Act regulations, from 2010 to 2017, the electric power industry has reduced mercury emissions by 86 percent and total emissions of hazardous air pollutants by 96 percent. National total power sector mercury emissions have been reduced by 96 percent over the period 1990 to 2023 (from 59 to 2.4 tons per year).
Power Plant Emissions Drop Significantly Since 1990
U.S. Power Sector Carbon Dioxide Emissions Declining
Transmission and Distribution
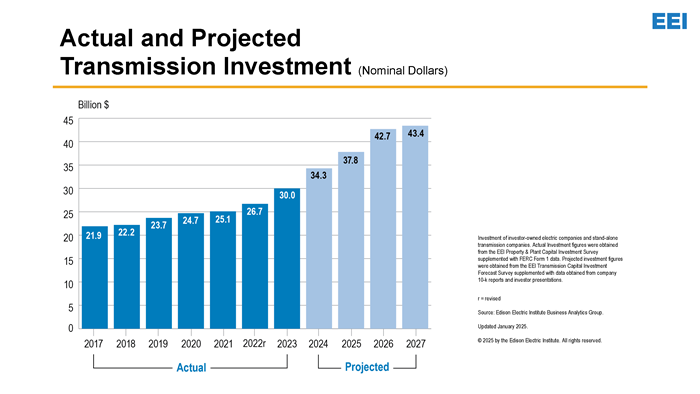
- In 2024, investor-owned electric companies spent $32.6 billion on transmission investment, compared to $30.0 billion in 2023 (in nominal dollars), and were projected to spend $39.9 billion in 2025.
- Investor-owned electric companies are planning to invest approximately $178 billion on transmission construction between 2025 and 2028 (in nominal dollars).
- In 2024, investor-owned electric companies spent $60.2 billion on distribution investment, compared to $56.7 billion in 2023 (in nominal dollars).
- Since 2001, investor-owned electric companies have invested $635 billion (in nominal dollars) on the U.S. distribution system.
Historical and Projected Transmission Investment
Financial
- In 2024, total energy operating revenues of investor-owned electric companies were $403 billion.
- Consolidated holding company-level assets of investor-owned electric companies were $2,177 billion as of December 31, 2024.
- Of these assets, $1,423 billion were net property in service.
- Total market capitalization of U.S. investor-owned electric companies was $1.017 trillion on December 31, 2024.
Customers, Sales, and Revenues
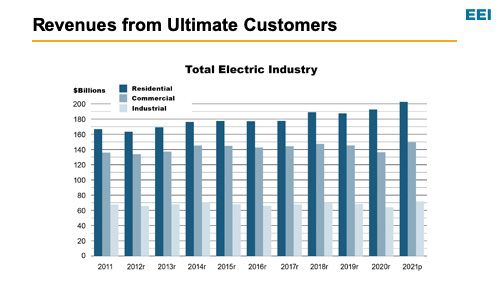
- In 2022, the average number of customers served by the electric power industry was 160,195,739.
- The average annual electricity use per residential customer in 2022 was 10,884 kilowatt-hours (kWh).
- In 2022, the average electricity price to residential customers was 15.12 cents/kWh.
Staff Contacts
Additional data inquiries can be sent to energydata@eei.org
